Potential home buyers and sellers continue to hesitate, prices continue to soften (August 2022 Market Report)
Lack of affordability drives further price declines as rebalancing continues

Lack of affordability drives further price declines as rebalancing continues
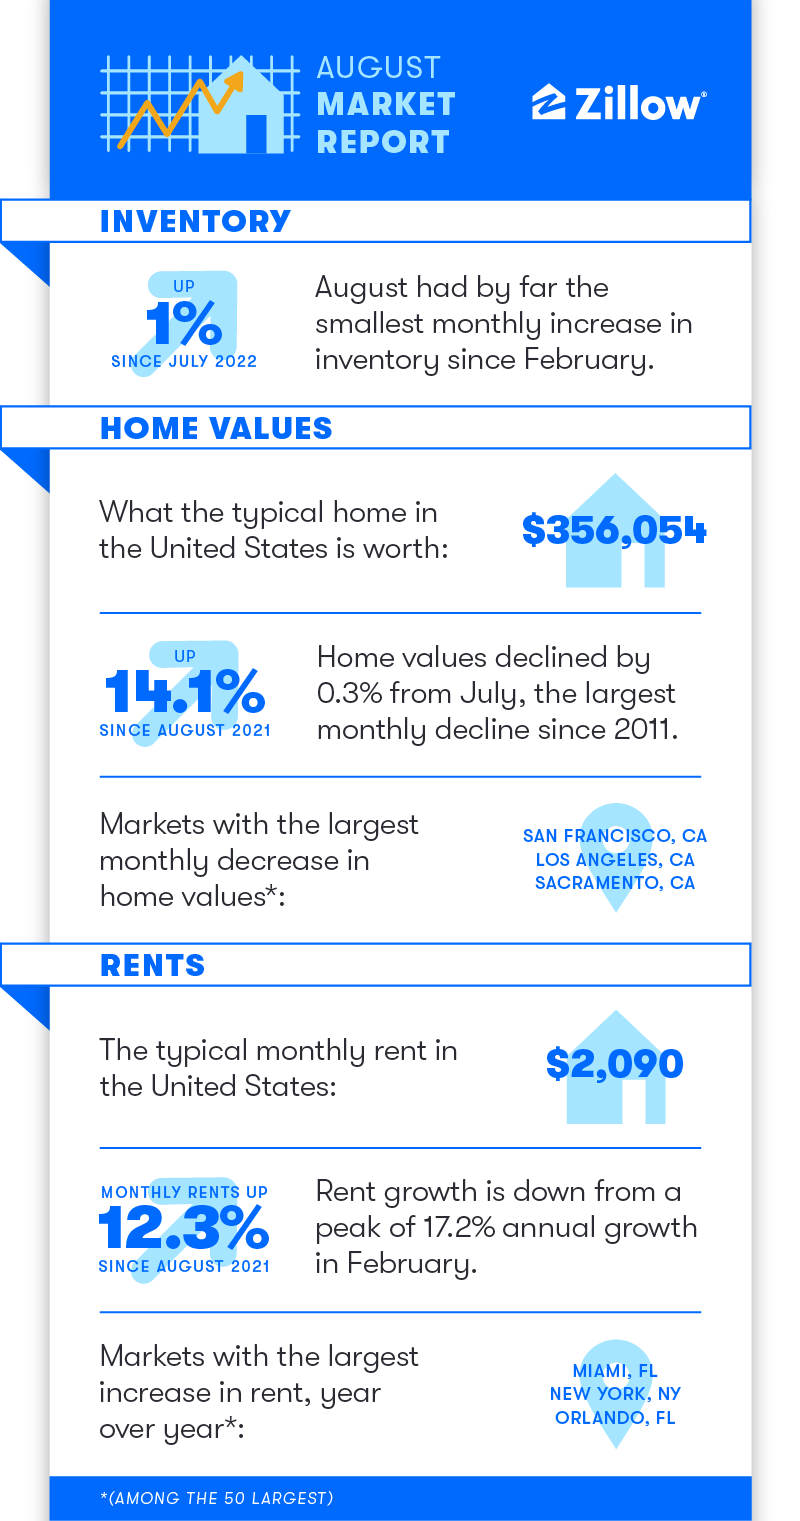
Home buyers continued to balk in the face of mortgage affordability obstacles this August, leaving less competition and more inventory of homes for sale in the market. The softer demand from buyers contributed to the largest monthly drop in home values, 0.3%, since 2011. Appreciation has receded since peaking in April, but typical home values are still up 14.1% from a year ago and 43.8% since August 2019, before the pandemic.
Typical mortgage payments show an even starker picture of the astronomical growth of expenses for new homeowners over the past three years. The historic rise in home prices over the pandemic, compounded by this year’s spiking mortgage rates, has pushed the monthly mortgage payment on a newly purchased typical home from $897 at the end of August 2019 to $1,643 last month, an 83% increase from this time of year before the pandemic. [1]
Recent volatility in mortgage rates makes it more difficult for many borrowers to qualify for a loan. Substantial week-to-week rate movements mean that many potential buyers are able to qualify for a loan one week, but not the next, or vice versa. Even buyers able to afford a house at current rates could feel frozen, waiting for mortgage rates to fall dramatically again like they did from the end of June to mid-July, when rates dropped 50 basis points in just two weeks.
As the share of median household income needed to pay monthly mortgage costs rises beyond the 30% level considered to be a financial burden, uncertainty itself could be holding up a large population of buyers who could otherwise still afford to move forward with a loan. It’s likely that this problem will continue until markets stabilize and return to some semblance of normalcy.
Reduced buying activity has left homes lingering on the market for longer. The typical listing now goes pending 16 days after first going active on Zillow, three days longer than in July and up from a mere 10 days last August. [2]
Inventory – the count of active listings across the nation – ticked up, rising 1% from July. This gives some good news for buyers, who now have more options to consider. But that’s by far the smallest monthly increase since February.
A significant decline in the flow of new listings to the market over the last two months – moving from 8.5% below 2021 levels in June to a nearly 23% year-over-year decline in August – shows that some would-be sellers are opting not to list, either in response to slowing sales, or in order to hold on to their low mortgage rates. New listings will be a key metric to watch in coming months: If the flow of new listings stays low, that could smother this year’s inventory rebound, leaving buyers still stuck with far fewer options for sale than before the pandemic.
The prime suspect to explain the pullback in homebuyer demand is the huge decline in affordability over the past year. The diverging fortunes of more and less affordable markets backs up the hypothesis. More affordable markets in the Midwest are generally retaining their heat while competition is cooling most rapidly in Western markets, especially those with the highest home prices and the ones that saw the most home price appreciation over the pandemic.
Home values rose from July to August in 12 of the 50 largest U.S. markets, led by Birmingham (0.9%), Indianapolis (0.5%), Cincinnati (0.4%) and Louisville (0.2%). Those four all have a typical home value well under $300,000. Miami, in the fifth spot, breaks the trend here, but also features the highest rent growth over the last three years by far, which could be stoking demand for purchases.
Values fell the furthest month over month in San Francisco (-3.4%), Los Angeles (-3.4%), Sacramento (-3.2%), and Salt Lake City (-2.6%).
Listings’ time to pending saw similar trends, decreasing since July by one day in Milwaukee and staying steady in St. Louis, Cincinnati, Columbus and Louisville. Markets with the largest increase were Las Vegas by 11 days, Austin (10), Phoenix (8), and Riverside (7).
Sellers may be coming to grips with the new market paradigm, as the share of listings with a price cut eased up by one percentage point since July. Now roughly 28% of listings receive a price cut nationally – slightly higher than August 2019’s rate of 22%. The share of listings with a price cut is highest in Salt Lake City (43%), Phoenix (43%), Las Vegas (42%) and Austin (39%). Markets with the lowest rates for price cuts are Milwaukee (15%), New York (16%), Hartford (20%) and Boston (20%).
Rent growth continued to ease up in August, with the typical nationwide rent of $2,090 now 12.3% above last August – down from a peak of 17.2% annual growth in February.[3] The rental market only partially overlapped with for-sale market trends, as Sunbelt markets and New York led the way on rent growth. Annual rent growth was strongest in Miami (21.9%), New York (17.9%), Orlando (17.5%) and San Diego (17.1%), while rent growth from last August was slowest in Minneapolis (5.0%), Baltimore (5.7%), San Francisco (6.9%) and Sacramento (7.0%). San Francisco and Sacramento stand out for registering among both the lowest rent and home value growth this month.
[1] Monthly principal & interest on a 30-year fixed-rate mortgage, for a loan of 80% of that month’s raw Zillow Home Value Index level, at the interpolated average 30-year interest rate reported by Freddie Mac’s Primary Mortgage Market Survey on the last day of the month. This is a methodology change from previous months’ market reports, which used the monthly average mortgage rates rather than end-of-month rates, to better capture the recent volatility in buyers’ experience shopping for a mortgage.
[2] Raw median days to pending; a smoothed (3-month moving average) version of this metric appeared in previous market reports.
[3] Beginning with publication of August 2022 data, Zillow is releasing an updated measure of our flagship gauge of rents, the Zillow Observed Rent Index (ZORI), which measures changes in asking rents over time, controlling for changes in the quality of the available rental stock in ways that other measures of rental prices cannot. ZORI data will be now be published at city and county levels, in addition to national, MSA, and ZIP levels. The methodology has been changed slightly, to reflect rents of the middle 30% of the distribution, which is analogous to the mid-tier headline ZHVI methodology in the for-sale market.
