
Our research team releases regular monthly housing trends reports. These reports break down inventory metrics like the number of active listings and the pace of the market. In addition, we continue to give readers more timely weekly updates, an effort that began in response to the rapid changes in the economy and housing as a result of the COVID-19 pandemic. Generally, you can look forward to a Weekly Housing Trends View and the latest weekly housing data on Thursdays with a weekly video update from our economists on Fridays. Here’s what the housing market looked like over the last week.
What this Week’s Data Means:
For the first time in two years, weekly data show that homes are taking longer to sell than they did at this time last year. The increase in time on market is just another one of the increasingly common flags that the housing trends that prevailed over the last two years are squarely in the rearview mirror. Market activity is downshifting in response to high prices and rising mortgage rates that mean fewer than one of every four listings on Realtor.com is affordable to the household earning $75,000.
Although home prices have not retreated, they decelerated this week, providing another signal that the market has shifted. Homeowners may be noting these dynamics and responding. The market saw fewer homes newly listed for sale for a fourth week in a row. With fewer fresh listings coming up for sale, active for-sale inventory growth steadied. Shoppers today see 30% more homes for sale than at this time one year ago, the same improvement as last week.
Despite the challenges and opportunities for home shoppers in today’s market, the homeownership rate continued to climb in the second quarter. Meanwhile vacancy rates at or near record lows among both owned and rented homes will keep upward pressure on prices and rents.
Key Findings:
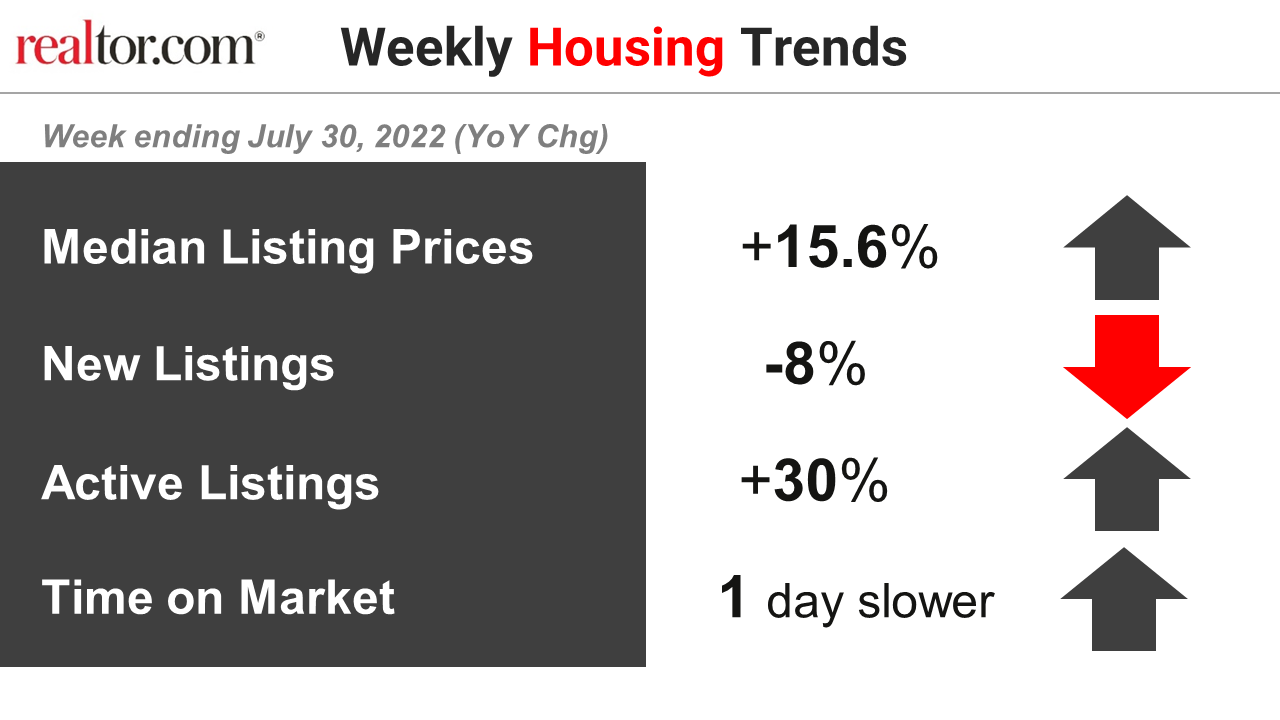
- The median listing price grew by 15.6% over last year. The typical asking price of for-sale homes was up from last year by double-digits for a 33rd week. Even though asking prices continue to climb, with the median hitting a new high of $450,000 in June, this week’s data shows a deceleration, or slowing rate of price growth, compared to last week. Growth in the median home listing price remains above the year-to-date average and well above what’s typical, but this deceleration is a sign of shifting balance in the market.
- New listings–a measure of sellers putting homes up for sale–were down 8% from one year ago. This week marks a fourth straight week of year over year declines in the number of new listings coming up for sale, suggesting that fewer homeowners are eager to list homes for sale in this rebalancing market. If sellers grow wary of participating in the market, that could slow the housing refresh, and buyers may see more of the same homes week to week rather than new options. Homeowners still on the fence about selling however should consider that with home equity at a record high, potential sellers remain in a fairly good position.
- Active inventory continued to grow, rising 30% above one year ago. The rate of improvement has stalled in recent weeks as the number of new listings dwindles, but the jump in active inventory does give today’s shoppers an extra home to consider for every 3 that were on the market at this time last year. Nevertheless, our June Housing Trends Report showed that the active listings count is not yet back to pre-pandemic levels, registering less than half its June 2019 level and just shy of two-thirds its June 2020 mark.
- Homes spent one extra day on the market compared to this time last year. This week’s data marks the first year-over-year increase in time on market in over two years, and more slowing could be ahead as the housing market resets. Time on market, like many of the housing indicators we track, signals the abrupt change the housing market has experienced as mortgage rates have climbed in 2022. As recently as February 2022, the Realtor.com Housing Trends report showed that homes sold more than two weeks faster than in the previous year. In the June Housing Trends Report homes spent 4 fewer days on the market than one year ago, and by late summer the monthly data is likely to show the increases in time on market that we’re beginning to see in the weekly data.
Data Summary:
| All Changes year-over-year | Year-to-Date 2022 | Week ending July 16, 2022 | Week ending July 23, 2022 | Week ending July 30, 2022 |
| Median Listing Prices | +14.7% | +16.6% | +16.6% | +15.6% |
| New Listings | -1% | -3% | -6% | -8% |
| Active Listings | -3% | +29% | +30% | +30% |
| Time on Market | 7 days faster | 1 day faster | 0 days faster | 1 days slower |
Subscribe to our mailing list to receive updates and notifications on the latest data and research.