
Our research team releases regular monthly housing trends reports. These reports break down inventory metrics like the number of active listings and the pace of the market. In addition, we continue to give readers more timely weekly updates, an effort that began in response to the rapid changes in the economy and housing as a result of the COVID-19 pandemic. Generally, you can look forward to a Weekly Housing Trends View and the latest weekly housing data on Thursdays with a weekly video update from our economists on Fridays. Here’s what the housing market looked like over the last week.
What this Week’s Data Means:
As we close out what is typically the biggest week of the year for home sales, the housing market continues to be replenished with homeowners deciding that now is the time to sell. This is good news for shoppers who will see the number of homes for sale climbing back toward pre-pandemic levels.
Anyone who bought a house before the last couple of years will note that the market is still relatively under-supplied, with the actual number of homes for sale still roughly half of what we saw in June 2019 and more than a third lower than June 2020, early in the pandemic, but June’s progress is a convincing step back in that direction and this first week of July built on that momentum. In other words, buyers are seeing more options. Of course one contributor to the rise of options for shoppers is that some searchers are putting plans on pause. Even though mortgage rates have taken a breather, slipping last week, they remain substantially higher than a year ago, shrinking buyer purchasing power enough to derail some plans to purchase.
Last week, I noted that ongoing seller participation in the housing market was key to continued inventory recovery. So far, the growing new listings trend remains intact. Another wildcard is buyer participation. Both new and pending home sales saw an uptick in May when expectations of higher future mortgage rates were climbing. However, if the recent pause in mortgage rates lingers, home shoppers could lose some sense of urgency, especially as their options grow.
In either case, buyers are likely to remain cost-sensitive. This could position condos and townhomes as a good, affordable choice for younger households hoping to buy for the first-time.
Key Findings:
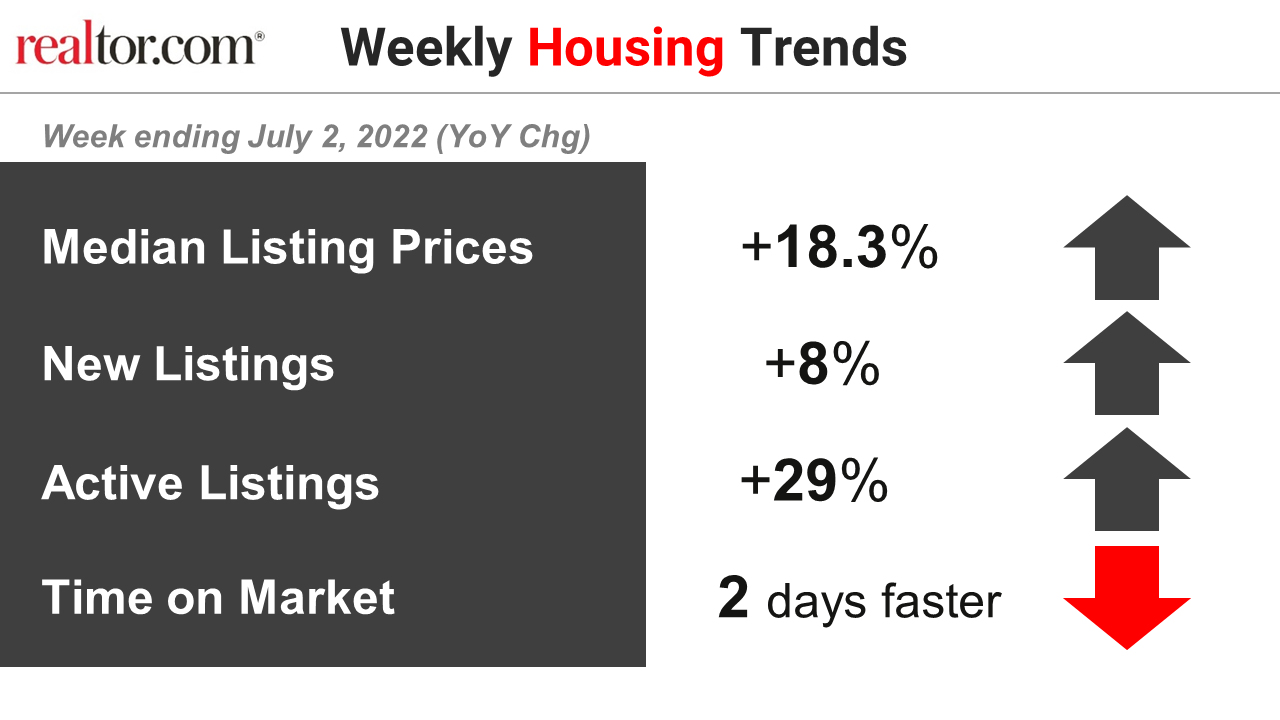
- The median listing price grew by 18.3% over last year. The typical asking price of for-sale homes was higher than one year ago by double-digits for a 29th week. This week’s growth rate picked up after several weeks of steady to slower year over year growth, and we expect that data quirks around the independence day holiday are playing a role. Because of this, we expect to see home price growth ease back lower in the weeks ahead and continue to slow in the second half of 2022. Still, home price growth continues and we saw a new recent high of $450,000 in June. Fortunately, we typically see the median home listing price top out around this time of year, and ease in the second half of the year. This means shoppers still in the market are likely to see some more lower-priced options.
- New listings–a measure of sellers putting homes up for sale–were up 8% above one year ago. Home owners trying to decide if now is the time to list their home for sale are still in a good position in many markets across the country as a decade of rising home prices gives them a substantial equity cushion, and buyer interest helps homes move quickly, shortening the typical home sale timeline. Strong market conditions have prompted more homeowners to sell homes this year compared to last. In fact, we’ve seen more homes come up for sale this year compared to last year in 13 of the last 14 weeks. Even as homes sell quickly, two in five sellers reported that it took longer to sell than expected, and this is before we saw time on market tick up by half a day in June over May 2022. If you’re contemplating a move, remember that it’s a process. Start exploring your home selling options here.
- Active inventory continued to grow, rising 29% above one year ago. More homeowners are taking advantage of still-strong housing market conditions just as higher mortgage rates and home prices are causing many buyers to reconsider their moving plans. As a result, the number of homes for sale is climbing rapidly. Inventory was roughly even with last year’s levels at the beginning of May and the gains have mounted each week with this most recent week seeing roughly four homes on the market for every three that a buyer at this time last year would have seen. Still, our June Housing Trends Report showed that the active listings count remained less than half its June 2019 level and just shy of two-thirds its June 2020 mark. Put another way, today’s shoppers have more options, but the market needs even more before the selection is on par with the pre-pandemic or even early-pandemic housing market.
- Homes spent just 2 days less on the market than this time last year. A smaller gap relative to last year indicates that the market is cooling faster this year than it did last year. In fact, the Realtor.com June Housing Trends Report showed that although homes spent less time on the market than one year ago, they sat for slightly longer than in May, a nod to seasonality and cooling buyer demand amid cost pressures. This is the first time in three months we did not see another new low record for time on market. More homes for sale will eventually bring more balance to the housing market, cooling the ultra-fast pace of home sales we’ve seen over the last few years. We’re already getting a hint of that.
Data Summary:
| All Changes year-over-year | Year-to-Date 2022 | Week ending June 18, 2022 | Week ending June 25, 2022 | Week ending July 2, 2022 |
| Median Listing Prices | +14.5% | +16.9% | +15.7% | +18.3% |
| New Listings | +0% | +6% | +5% | +8% |
| Active Listings | -8% | +21% | +25% | +29% |
| Time on Market | 8 days faster | 4 days faster | 3 days faster | 2 days faster |
Subscribe to our mailing list to receive updates on the latest data and research.