

Our research team releases regular monthly housing trends reports. These reports break down inventory metrics like the number of active listings and the pace of the market. In addition, we continue to give readers more timely weekly updates, an effort that began in response to the rapid changes in the economy and housing as a result of the COVID-19 pandemic. Generally, you can look forward to a Weekly Housing Trends View and the latest weekly housing data on Thursdays with a weekly video update from our economists on Fridays. Here’s what the housing market looked like over the last week.
What this Week’s Data Means:
Despite a small uptick, the general trend for home price growth is cooler, with the rate notably lower than what we saw between March and August. This typical seasonal trend, coupled with an already cooling market responding to tighter financial conditions, means that homes sit on the market longer than they did one year ago. Although the number of newly-listed options was smaller last week, today’s shoppers have more than 5 homes to consider for every 4 they had at this time a year ago. It will favor persistent and informed buyers who are ready to purchase, especially as the season quickly approaches the best time to buy.
In addition to the seasonal cooling off, the 30-year fixed mortgage rates passed over 6% this week, the highest level since the fall of 2008. While sellers have already been less optimistic about conditions than a year ago, climbing mortgage rates might further worsen their confidence, despite the fact that on the whole, selling conditions remain relatively favorable. Some sellers have responded to this shift by pulling back new listings, while others react by cutting asking prices, especially for those hoping to sell before year-end. On buyers’ side, there is no doubt that the increasing mortgage rate will make home buying even more challenging, but buyers may still find opportunities as these changes coincide with the time of the year when buyers have historically found the best market conditions to obtain more bargaining power.
Key Findings:
-
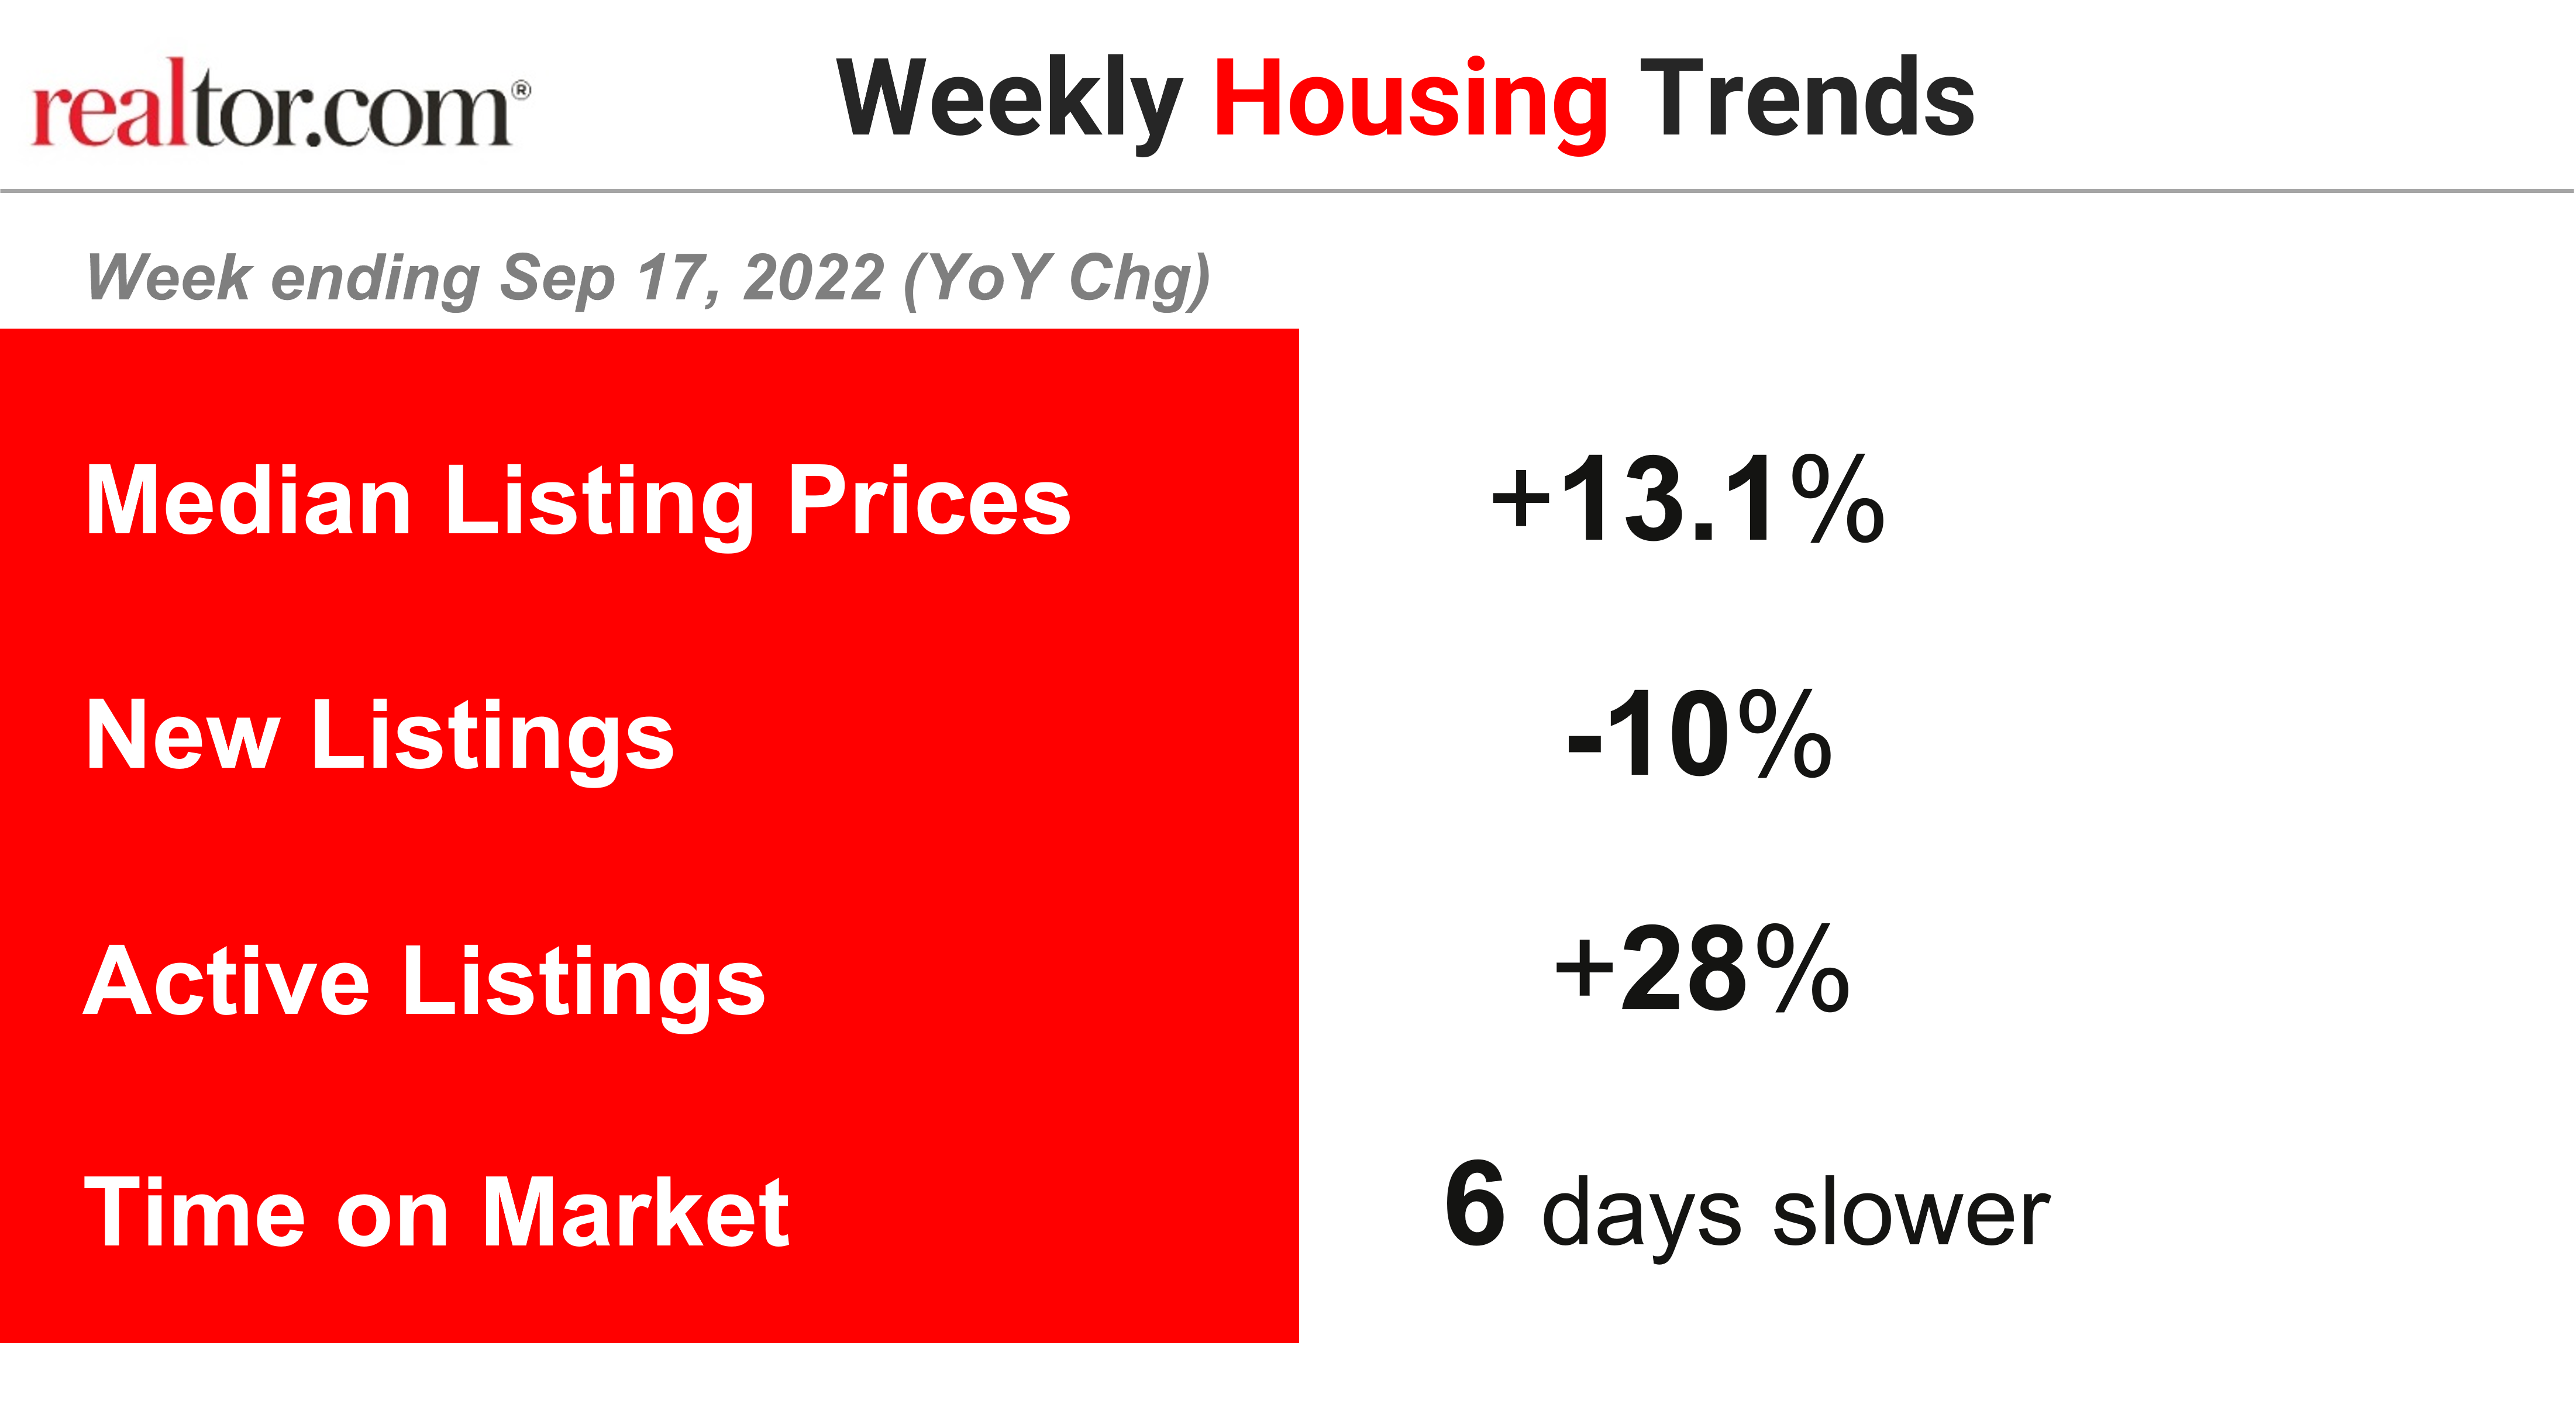
The median listing price grew by 13.1% over last year.
The typical asking price of for-sale homes continues to exceed last year’s level by double-digits, hitting a 40th week at double-digit pace. While the pace is ahead of last week’s dip, it still marks the second slowest growth seen since March. Home prices typically decline as we move into the second half of the year, one of the key seasonal trends that help make fall the best time to buy a home, particularly for first-time buyers. This year’s data suggests that shoppers in the best week, September 25th-October 1st, could see a national median list price $20,000 lower than June’s all-time high of $450,000.
-
New listings–a measure of sellers putting homes up for sale–were again down, dropping 10% from one year ago.
This week marks the eleventh straight week of year over year declines in the number of new listings coming up for sale, and this week the data continues to maintain at double-digit territory. While the latest Fed data confirm that homeowners contemplating a sale continue to be in a good position, sitting on a record high level of housing equity at the end of the second quarter, recent survey data show that sellers are less optimistic about conditions compared to a year ago. In addition, the latest 30-year fixed mortgage rates passed 6% for the first time since 2008, which could further dampen the new listing trends.
-
Active inventory continued to grow, and improved 28% above one year ago.
The number of homes for sale has grown as buyers and sellers navigate a rebalancing housing market with shifting advantages and challenges. Today’s shoppers generally have more homes to consider than last year’s shoppers did, but the market is still not back to pre-pandemic inventory levels. In fact, our August Housing Trends Report showed that the active listings count still trails its 2020 and 2019 levels by more than 7% and 43%, respectively. Still, shoppers have more options than they’ve had in a long time. On top of this, we’re approaching fall, which is typically the annual seasonal high-mark for active inventory, and one of several reasons why we identify late September as the best time to buy a home.
-
Homes spent six extra days on the market compared to this time last year.
For the eighth week in a row, homes are sitting on the market for a longer time than last year, but relative to pre-pandemic, shoppers need to make faster decisions. And depending on location shoppers may also find more or less time on market. Our August Hottest Markets report shows that some of the fastest moving, most in-demand markets right now are areas in the Northeast and Midwest that offer buyers affordability. And with more shoppers than ever before willing to look across state lines for a home, affordable areas are likely to see ongoing demand.
Data Summary:
| All Changes year-over-year | Year-to-Date 2022 | Week ending Sep 3, 2022 | Week ending Sep 10, 2022 | Week ending Sep 17, 2022 |
| Median Listing Prices | +14.5% | +13.4% | +11.7% | +13.1% |
| New Listings | +2% | -6% | -13% | -10% |
| Active Listings | +3% | +27% | +27% | +28% |
| Time on Market | 5 days faster | 5 days slower | 6 days slower | 6 days slower |
Subscribe to our mailing list to receive updates and notifications on the latest data and research.