
Our research team releases regular monthly housing trends reports. These reports break down inventory metrics like the number of active listings and the pace of the market. In addition, we continue to give readers more timely weekly updates, an effort that began in response to the rapid changes in the economy and housing as a result of the COVID-19 pandemic. Generally, you can look forward to a Weekly Housing Trends View and the latest weekly housing data on Thursdays with a weekly video update from our economists on Fridays. Here’s what the housing market looked like over the last week.
What this Week’s Data Means:
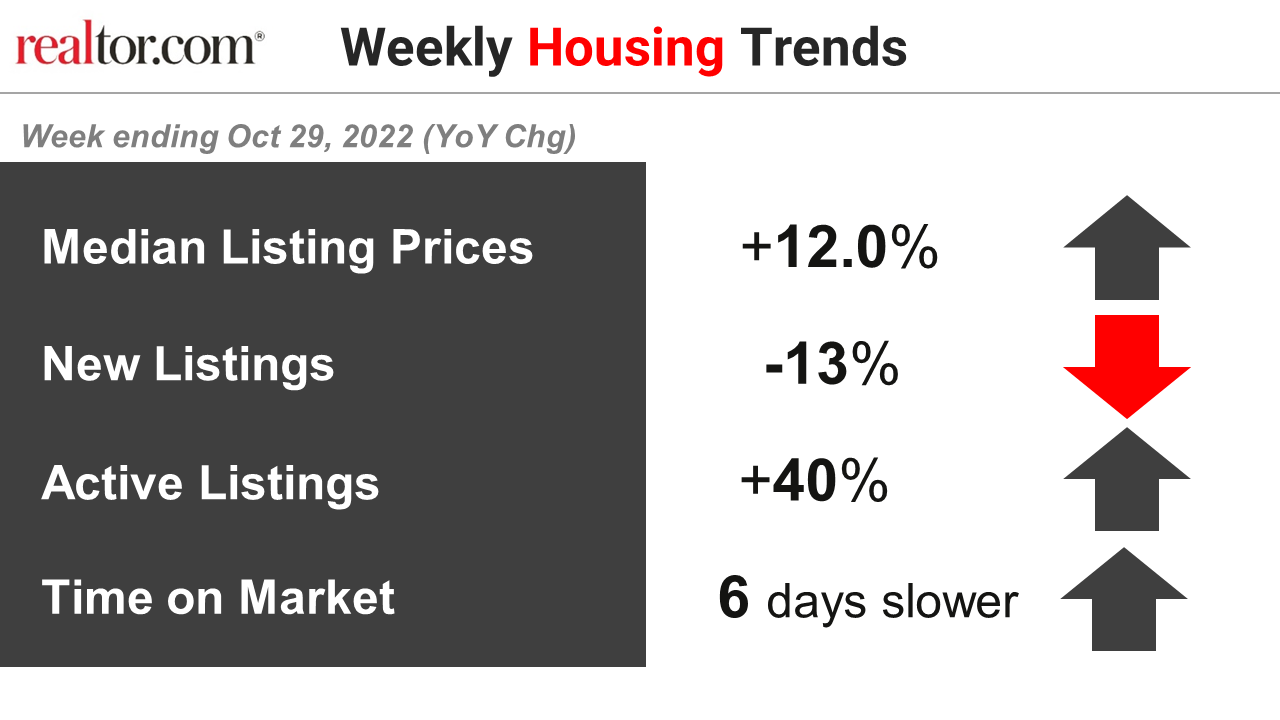
For a third week, active inventory is growing at a faster clip as mortgage rates surpass 7%. This trend helped propel active listings to above their 2020 level in the same month for the first time in October. New listings data suggests that homeowners remain reluctant to sell even as time on market was just 6 days slower than last year’s pace. Home price growth continued to moderate, but remains at a double-digit pace, even though data show that price cuts are only just below the highest October share in the last 6 years.
While homeownership rate data for the third quarter showed that home shoppers had success in the market, the hurdles are getting higher. Mortgage costs soared more than 77% compared to a year ago in October, and it’s likely more increases are ahead. In the statement and press conference following the November FOMC meeting, Chair Powell made it clear that taming inflation is a top priority that will likely require a higher policy rate than was previously expected. Mortgage rates are likely to follow these expectations higher.
Key Findings:
- The median listing price grew by 12.0% over last year. The typical asking price of for-sale homes continues to exceed last year’s level by double-digits, hitting a 44th week at double-digit pace. However, the pace of growth shrank again. Our October Housing Trends Report shows that the typical price of a home for sale on Realtor.com was $425,000, down from summer’s peak of $450,000.
- New listings–a measure of sellers putting homes up for sale–were again down, dropping 13% from one year ago. This marks the seventeenth week of year over year declines in the number of new listings coming up for sale. This week’s decline matched last week’s, but still means fewer new choices for home shoppers in the market. Despite affordability challenges in today’s housing market, the homeownership rate continued to climb in the third quarter as households looked to lock in monthly payments and avoid having to navigate still climbing rental costs. With most homeowners locked into mortgage rates well-below currently prevailing rates, the number of new listings is likely to remain low, but our October Housing Trends Report shows some exceptional areas where new listings are growing, all of which were in the South.
- Active inventory continued to grow, increasing 40% above one year ago. This is the third week of a more notable step up in inventory gains after rough stability since July. Find a good recap of recent inventory trends in the Housing Trends View from mid-October. As active inventory climbs sharply from its early year low, monthly data from October show that for the first time, inventory has surpassed what was available for the comparable month in 2020. This comes even though new listings remain muted relative to last fall, highlighting the impact of higher mortgage rates, which surpassed 7% last week, on buyer demand. And while the Fed’s statement following its November meeting laid out considerations that might indicate a slowing in the pace of tightening, both the statement and Chair Powell’s press conference made it abundantly clear that additional rate hikes are ahead.
- Homes spent six extra days on the market compared to this time last year. For a fourteenth week in a row, homes spent more time on market than last year albeit a slightly smaller bit extra. Homeowners ready to sell in this market should be prepared with an extra measure of patience. Buyers who haven’t called off the search as mortgage rates continue to climb will likely have more time to make decisions, but may still want to move expeditiously if set on buying in the near term as November’s Fed meeting likely put additional upward pressure on mortgage rates.
Data Summary:
| All Changes year-over-year | Year-to-Date 2022 | Week ending Oct 15, 2022 | Week ending Oct 22, 2022 | Week ending Oct 29, 2022 |
| Median Listing Prices | +14.0% | +13.2% | +13.0% | +12.0% |
| New Listings | -5% | -15% | -13% | -13% |
| Active Listings | +6% | +34% | +36% | +40% |
| Time on Market | 4 days faster | 7 days slower | 7 days slower | 6 days slower |
Note: With the release of its September 2022 Housing Trends Report, Realtor.com® incorporated a new and improved methodology for capturing and reporting housing inventory trends and metrics. The new methodology updates and improves the calculation of time on market and improves handling of duplicate listings. Most areas across the country will see minor changes with a smaller handful of areas seeing larger updates. As a result of these changes, the data released since September 29, 2022 will not be directly comparable with previous data releases (files downloaded before September 29, 2022) and Realtor.com® economics blog posts. However, future data releases, including historical data, will consistently apply the new methodology.
Subscribe to our mailing list to receive updates and notifications on the latest data and research.