
Our research team releases regular monthly housing trends reports. These reports break down inventory metrics like the number of active listings and the pace of the market. In addition, we continue to give readers more timely weekly updates, an effort that began in response to the rapid changes in the economy and housing as a result of the COVID-19 pandemic. Generally, you can look forward to a Weekly Housing Trends View and the latest weekly housing data on Thursdays with a weekly video update from our economists on Fridays. Here’s what the housing market looked like over the last week.
What this Week’s Data Means:
As we saw in last week’s housing data, active inventory is growing at a faster clip as mortgage rates approach 7%, a threshold very likely to be exceeded in widely followed mortgage rate data later today. Active inventory’s renewed advance even as time on market trends didn’t budge at all over the week is somewhat attributable to a smaller decline in new listings alongside moderating demand. Home price growth moderated, but remains at double-digit pace, and alongside higher rates is putting a big dent in home shopper budgets. With affordable homebuying options dwindling, some shoppers are looking elsewhere. This gives the markets that topped our Fall Emerging Housing Markets Index, released in collaboration with the Wall Street Journal, like Johnson City, TN, where the median home listing price was under $400,000, an edge.
Key Findings:
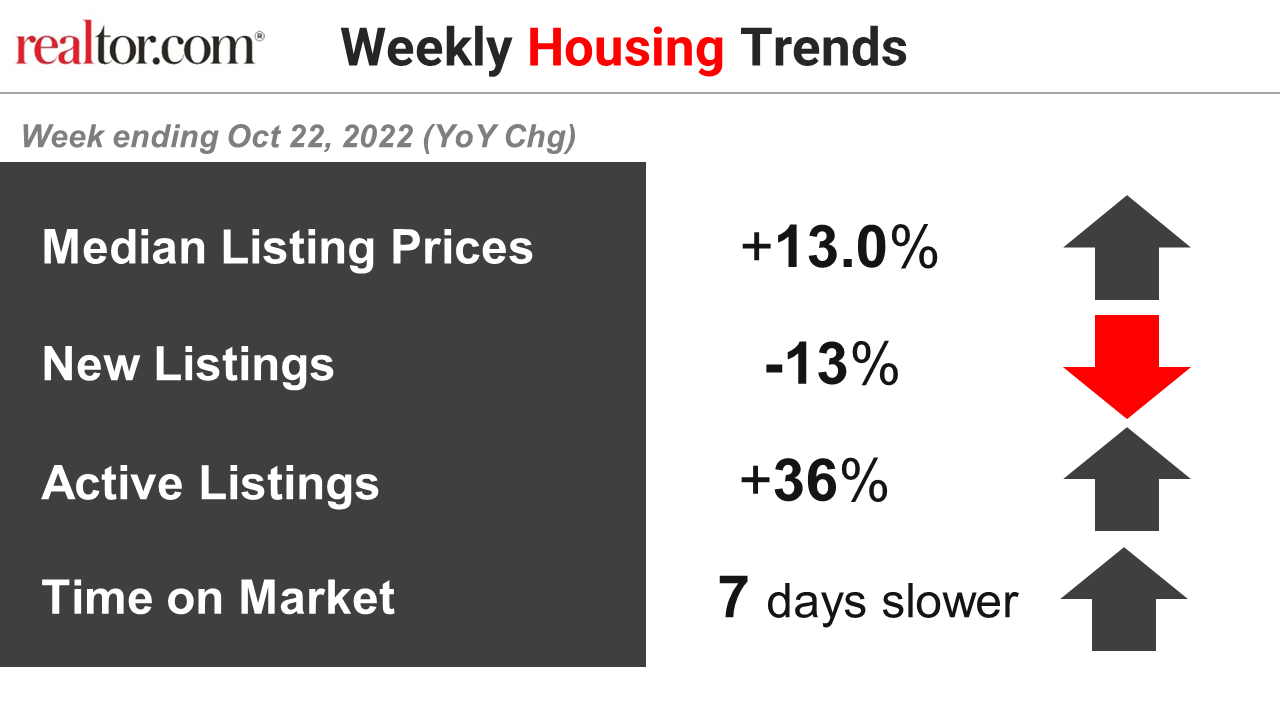
- The median listing price grew by 13.0% over last year. The typical asking price of for-sale homes continues to exceed last year’s level by double-digits, hitting a 43rd week at double-digit pace. Just like other price trackers, such as the Case-Shiller Home Price Indices, our measure of home price growth is moderating. Rising mortgage rates and cooling housing demand led to a modest drop from last week’s 13.2%. Still, the fast growth of home prices and higher mortgage rates mean that home shoppers are still seeking out affordability. Markets that offer good real estate value, such as the markets that topped our Fall Emerging Housing Markets Index, released in collaboration with the Wall Street Journal, like Johnson City, TN, will attract home shoppers.
- New listings–a measure of sellers putting homes up for sale–were again down, dropping 13% from one year ago. This week marks the sixteenth straight week of year over year declines in the number of new listings coming up for sale. This week’s decline was somewhat smaller than last week’s, but still means fewer fresh options for home shoppers in the market. Seasonally, fewer homeowners contemplate a home sale as the temperature cools and the holidays approach, but this kind of change in the year over year trend signals a cooling that’s more than just seasonal. Lackluster selling interest from homeowners combined with a builder-driven pullback in new construction have slowed the speed at which the housing market is rebalancing in light of lower demand.
- Active inventory continued to grow, increasing 36% above one year ago. In last week’s Housing Trends View, which marked the first big increase in the active inventory trend since July, we gave a helpful summary of the historical context and timing of recent inventory developments. This week we saw another sizable step up in the active inventory trend (from 34% last week to 36% this week), even as new listings remain low, and the driving factor is the same: climbing mortgage rates, which were very near 7% last week and are likely to top that mark this week. Higher mortgage rates coupled with higher home prices have drastically curtailed buying power and with it sales activity for both existing homes and new homes.
- Homes spent one whole week extra on the market compared to this time last year. For the thirteenth week in a row, homes are sitting on the market for a longer time than last year. For homeowners contemplating a sale, this means planning for extra time in the process and making sure you’re breaking these other “rules” that became gospel in 2021’s frenzied housing market. For buyers, it may mean a bit more time to think through options, depending on your location. It may not be a buyer’s market yet, but this trend is certainly more buyer friendly.
Data Summary:
| All Changes year-over-year | Year-to-Date 2022 | Week ending Oct 8, 2022 | Week ending Oct 15, 2022 | Week ending Oct 22, 2022 |
| Median Listing Prices | +14.1% | +13.3% | +13.2% | +13.0% |
| New Listings | -5% | -15% | -15% | -13% |
| Active Listings | +6% | +31% | +34% | +36% |
| Time on Market | 5 days faster | 7 days slower | 7 days slower | 7 days slower |
Note: With the release of its September 2022 Housing Trends Report, Realtor.com® incorporated a new and improved methodology for capturing and reporting housing inventory trends and metrics. The new methodology updates and improves the calculation of time on market and improves handling of duplicate listings. Most areas across the country will see minor changes with a smaller handful of areas seeing larger updates. As a result of these changes, the data released since September 29, 2022 will not be directly comparable with previous data releases (files downloaded before September 29, 2022) and Realtor.com® economics blog posts. However, future data releases, including historical data, will consistently apply the new methodology.
Subscribe to our mailing list to receive updates and notifications on the latest data and research.